-
Introducing Reports in Helprace
Fri, 3 Nov 2017, in Help Desk, Helprace, Releases

You can’t offer great customer service without knowing what’s really happening behind the scenes. That’s because there are tons of customer service metrics you should be measuring.
Today’s an important day for us at Helprace because we’re finally sharing the various reporting functions available to help desk software account holders.
What are reports? Why do I need them?
Reports help you track everything that happens in Helprace, starting from certain, specific IT help desk components to individual agent performance. This keeps you in the loop of how well your support software is doing without costly second-guessing. Report data is calculated in real-time, so what you see is always the latest, up-to-the-minute information.
There are four types of reports: Tickets, Productivity, Happiness and Team.
Tickets report

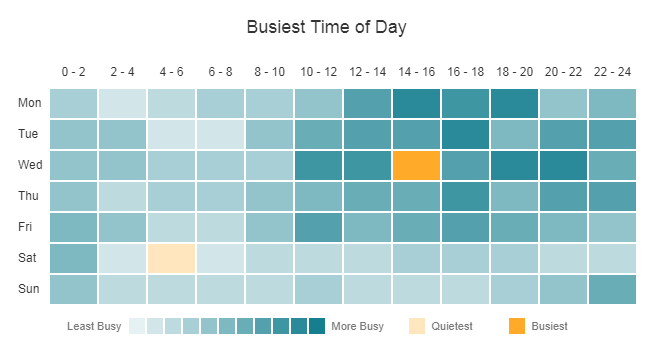
Manning your help desk without reports is like flying blind. Was there a busy day that put a strain on operations? How many tickets, feedback or bug reports did you get during a specific period? Are you using a certain workflow, tag or saved reply often enough?
So what?
Should certain tickets be better utilized as knowledge base articles? Maybe a certain saved reply should be split or merged in with other workflows? The possibilities for improvement are truly endless.Productivity report

When your team isn’t at it best, it hurts more than the bottom line. If left unchecked, it puts a dent in morale and job satisfaction. How many replies are really needed before your tickets are solved? It’s important to understand the speed and quality of every customer service interaction.
So what?
Learning from past data, you’ll be able to win customers over by saying the right things at first contact. You’ll know exactly where you’re improving, and where you’re slipping and when to be on your best behavior.Happiness Report

When you enable satisfaction ratings, customers will receive a short email asking them to rate their recent correspondence with you. Clicking either “Good” or “Bad” will register that vote automatically with an opportunity to add a comment.
What happens with the data you collect? Well, we created a new report aptly called the Happiness report which displays the percentage of people that are happy with your service. The percentage of “great” ratings are subtracted from the percentage of “poor” ratings to give a happiness score.
So what?
If you’re recieving lots of bad ratings, use every chance to follow up with the customer. Happiness reports can be used as a scoreborad by the watercooler, for gamification and team building activities.Team Report

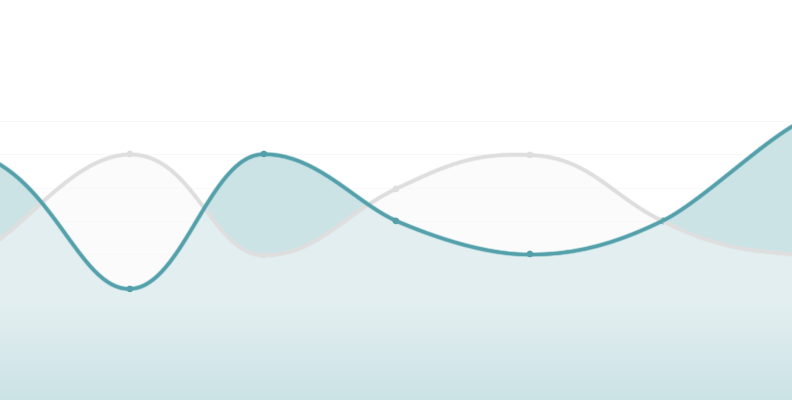
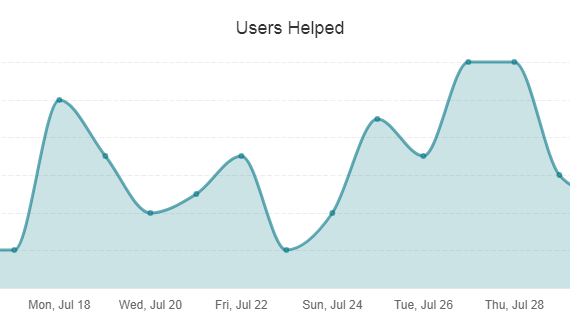
When it comes to your team, sometimes you need to understand how all your team members stack against each other. Who is leading and who is following? You’re now able to single out a particular team member and see how many users they are helping – relative to everyone else.
So what?
Team synergy is paramount for performance and goal-setting. How are you delegating accountability? Perhaps one of your team members needs a push in the right direction; others may deserve a raise – now you’ll know.It’s all in the numbers!
Since virtually every company varies in size, business model and values, it also makes sense that no customer service metric is “one size fits all”. Support teams and managers across departments need access to all the data – and then draw on the types that apply to them.
In the end, data gives you the ability to stay proactive instead of reactive. It keeps teams coherent and individuals accountable. To familiarize yourself with Helprace reports, feel free to explore reports in our knowledge base.
All set! Now you should be on the way to growing your support department in the right direction. Questions or feedback? Don’t forget to drop us a line if you have anything to share.


